Electoral performance of the Indian National Congress in states where approximately 65% of India’s total Muslim population resides.
This article gives an account of the performance of the Indian National Congress in elections held since 1995 for states where the Muslim population is more than 5% of the country’s total Muslim population. According to the 2011 census, 14.23% (more than 17 crore) of the total population of India is Muslim.
65% of India’s total Muslim population (more than 9Cr) resides in 6 states namely 1) Uttar Pradesh 2) West Bengal 3) Bihar 4) Maharashtra 5) Assam 6) Kerala (Table 0). The remaining 35% Muslim population resides in states other than the above six states (Chart 2)
Table A
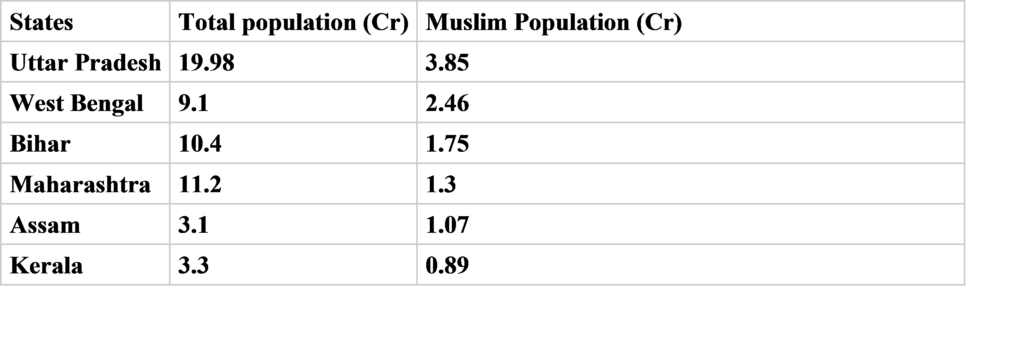
Table B: Lok Sabha constituencies by Muslim population:
MUSLIM POPULATION
| SL NO | LESS THAN 10% | 10-19.99% | 20-39.99% | MORE THAN 40% | TOTAL |
| 1 | 282 | 165 | 67 | 29 | 543 |
Muslims are a minority in 95% of the Lok Sabha constituencies and a majority only in 5% of Lok Sabha constituencies. Only 15 parliamentary seats have more than 50% Muslim population. The Muslim population is substantially decisive (35% and above) in more than 10% of parliamentary constituencies i.e., 57 seats.
Analysis of the electoral performance:
- Uttar Pradesh: About 3.85 crore Muslim population resides in the state i.e. 19.26% of the total population of the state and 22.34% of the country’s Muslim population. The seat and vote percentage of Congress in the Lok Sabha and Assembly elections held in or after 1995 can be seen in table 1 and Table 2 respectively.
Table UP1 (General Election results)
| 1996 | 1998 | 1999 | 2004 | 2009 | 2014 | 2019 | |
| Total Seats | 85 | 85 | 85 | 80 | 80 | 80 | 80 |
| Contested | 85 | 76 | 76 | 73 | 69 | 67 | 67 |
| Seats won by INC | 5 | 0 | 10 | 9 | 21 | 2 | 1 |
| INC vote % | 8.1% | 6.0% | 14.7% | 12.0% | 18.2% | 7.5% | 6.3% |
Table UP2 (Assembly Election Results)
| 1996 | 2002 | 2007 | 2012 | 2017 | 2022 | |
| Total Seats | 425 | 403 | 403 | 403 | 403 | 403 |
| Contested | 126 | 402 | 393 | 355 | 114 | 401 |
| Seats won by INC | 33 | 25 | 22 | 28 | 7 | 2 |
| INC vote % | 8.3% | 8.96% | 8.61% | 11.63% | 6.25% | 2.33% |
The Congress party has been out of power in Uttar Pradesh since 1989. In the last seven general elections in the Lok Sabha, the Congress has crossed the double-digit marks only twice. While the Congress has won a maximum of 33 seats in the last five assembly elections, its worst performance was during the 2017 election when the party managed to win only 7 seats.
The rise of parties like the Samajwadi Party (SP) and the Bahujan Samaj Party (BSP) in UP coincided with the decline of the political fortunes of the Indian National Congress. These parties filled the void created by the Congress party and reached out to the Muslims; These parties nominated Muslim candidates as part of their outreach gesture. In Uttar Pradesh, Muslims have voted for parties they believed had the best political substitute against the Bharatiya Janata Party (BJP).
Muslims play an influential role in elections, especially in constituencies where their numbers are high, despite the fact that not a single Muslim candidate from UP was elected to the Lok Sabha in the 2014 general election. In the 2019 general election, only 6 Muslim candidates won from UP. In 2012, 63 Muslims were elected to the 403-member UP state assembly. The representation of Muslims reached a new low in the 2017 assembly elections with only 24 candidates winning.
- West Bengal: About 2.46 crore Muslim population resides in the state i.e., 27.01% of the total population of the state and 14.31% of the total Muslim population of India. The seat and vote percentage of Congress in the Lok Sabha and Assembly elections held since 1995 can be seen in table 3 and Table 4 respectively.
Table WB1 (General Election results)
| 1996 | 1998 | 1999 | 2004 | 2009 | 2014 | 2019 | |
| Total Seats | 42 | 42 | 42 | 42 | 42 | 42 | 42 |
| Contested | 42 | 39 | 41 | 37 | 14 | 42 | 40 |
| Seats won by INC | 9 | 1 | 3 | 6 | 6 | 4 | 2 |
| INC vote % | 40.1% | 15.2% | 13.3% | 14.6% | 13.5% | 9.7% | 5.7% |
Table WB2 (Assembly Election Results)
| 1996 | 2001 | 2006 | 2011 | 2016 | 2021 | |
| Total Seats | 288 | 288 | 288 | 288 | 288 | 42 |
| Contested | 288 | 60 | 262 | 66 | 92 | 42 |
| Seats won by INC | 82 | 26 | 21 | 42 | 44 | 0 |
| INC vote % | 39.5% | 8% | 14.7% | 9.1% | 12.4% | 3.03% |
In the last seven Lok Sabha elections held in West Bengal, the Congress has never crossed the double figure, the maximum number of nine seats came in the 1996 general election. The vote percentage fell to the lowest 5.7% during the 2019 general election.
Congress has been out of power in the state for the last 45 years. Siddhartha Shankar Ray stepped down as the last Chief Minister of the Congress in 1977. In the last six assembly elections, the Congress had secured the maximum of 82 seats in 1996 when the party secured 39.5% of the total valued votes. This figure kept falling and Congress did not get any seats in the 2021 assembly elections and its vote percentage fell to the lowest 3.03%.
According to the census, 51% of Malda’s population is Muslim, and the figure stands at 66% in Murshidabad. AITC led in 5 out of 9 seats in Malda, and 16 out of 20 in Murshidabad. In Birbhum, which has more than 37% Muslim population, the AITC led in 10 out of 11 seats. All 9 seats in Kolkata where Muslims are in sizeable numbers were won by AITC candidates.
- Bihar: About 1.75 crore Muslim population resides in the state i.e., 16.9% of the total population of the state and 10.19% of the total Muslim population of India. The seat and vote percentage of Congress in the Lok Sabha and Assembly elections held in or after 1995 can be seen in table 5 & table 6 respectively.
Table BH1 (General Election results)
| 1996 | 1998 | 1999 | 2004 | 2009 | 2014 | 2019 | |
| Total Seats | 54 | 54 | 54 | 40 | 40 | 40 | 40 |
| Contested | 54 | 21 | 16 | 4 | 37 | 12 | 9 |
| Seats won by INC | 2 | 5 | 4 | 3 | 2 | 2 | 1 |
| INC vote % | 13% | 7.3%% | 8.8% | 4.5% | 10.3% | 8.6% | 7.9% |
Table BH2 (Assembly Election Results)
| 1995 | 2000 | 2005 (Feb) | 2005 (OCT) | 2010 | 2015 | 2020 | |
| Total Seats | 324 | 324 | 243 | 243 | 243 | 243 | 243 |
| Contested | 320 | 324 | 84 | 51 | 243 | 41 | 70 |
| Seats won by INC | 29 | 23 | 10 | 9 | 4 | 27 | 19 |
| INC vote % | 16.3% | 11.1% | 5% | 6.1% | 8.4% | 6.8% | 9.6% |
In the last seven Lok Sabha elections held in Bihar, the Congress had won the maximum five seats during the 1998 general election. In the 2019 general elections, the Congress won just one seat while the overall vote share stood at 7.9%.
The Congress has been out of power in the state of Bihar for the last 32 years, the Congress has been replaced by the regional parties Rashtriya Janata Dal (RJD) and Janata Dal-United (JDU). In the last seven assembly elections, the Congress had got the maximum 29 seats in 1995. In the last assembly elections, the number of seats has come down to 19. More or less the same is the case with vote percentage as well, in the last election the Congress got only 9.6% votes.
- Maharashtra: About 1.3 crore Muslim population resides in the state i.e., 11.54% of the total population of the state and 7.53% of the total Muslim population of India. The seat and vote percentage of Congress in the Lok Sabha and Assembly elections held since 1995 can be seen in table 7 & table 8 respectively.
Table MAH1 (General Election results)
| 1996 | 1998 | 1999 | 2004 | 2009 | 2014 | 2019 | |
| Total Seats | 48 | 48 | 48 | 48 | 48 | 48 | 48 |
| Contested | 48 | 41 | 42 | 26 | 25 | 26 | 25 |
| Seats won by INC | 15 | 33 | 10 | 13 | 17 | 2 | 1 |
| INC vote % | 34.8% | 43.6 | 29.7% | 23.8% | 19.6% | 18.3% | 16.4% |
Table MAH2 (Assembly Election Results)
| 1995 | 1999 | 2004 | 2009 | 2014 | 2019 | |
| Total Seats | 288 | 288 | 288 | 288 | 288 | 288 |
| Contested | 286 | 249 | 157 | 170 | 287 | 147 |
| Seats won by INC | 80 | 75 | 69 | 82 | 42 | 44 |
| INC vote % | 31% | 27.2% | 21.1% | 21% | 18.1% | 16.1% |
The Congress won the maximum number of 33 seats out of 48 Lok Sabha seats in Maharashtra in 1998. After 1998, the vote percentage of the Congress continued to decline and in the 2019 general election, the lowest vote was witnessed 16.4%, while only one candidate managed to win the seat. The Congress has been in power in the state with the help of coalitions for 17 out of the last 27 years, but the vote percentage has been steadily declining since 1995. In the 2019 assembly elections, the Congress got a minimum of 16.1% votes. In the 2014 and 2019 assembly elections, it got 42 and 44 seats respectively. At present, Congress has become the number four party in the Maharashtra Legislative Assembly.
- Assam: About 1.07 crore Muslim population resides in the state i.e., 34. 22% of the total population of the state and 6.20% of the total Muslim population of India. The seat and vote percentage of Congress in the Lok Sabha and Assembly elections held since 1995 can be seen in the table 9 & table 10 respectively.
Table ASM1 (General Election results)
| | 1996 | 1998 | 1999 | 2004 | 2009 | 2014 | 2019 |
| Total Seats | 14 | 14 | 14 | 14 | 14 | 14 | 14 |
| Contested | 14 | 13 | 14 | 14 | 13 | 13 | 14 |
| Seats won by INC | 5 | 10 | 10 | 9 | 7 | 3 | 3 |
| INC vote % | 31.6% | 39% | 38.4% | 35.1% | 34.9% | 29.9% | 35.8% |
Table ASM2 (Assembly Election Results)
Assam’s Muslim voters, who constitute 35% of the electorate, recorded an average turnout of 84% in the 34 constituencies where they are in majority. 7 constituencies with a majority Muslim voter turnout recorded a turnout of slightly over 90% and 3 constituencies with a turnout of slightly over 89%. Out of these 10 seats, 4 were won by the Indian National Congress and 6 by the AIUDF in the year 2016. The ruling party in the 126-member Assam Assembly, with 35% Muslim population, will not have a Muslim representative for the first time in at least half a century. BJP had fielded 8 Muslim candidates, but all failed to win.
The Mahajot coalition led by the Indian National Congress has 31 Muslim representatives this time. The number of Muslim candidates in Assam increased to 31 as compared to the previous election figures of 29 in 2016 and 28 in 2011. Out of 31 Muslim candidates, 16 were fielded by Congress and 15 by AIUDF. In the elections to the Assam Legislative Assembly, the Congress has ruled for 15 years out of the last 26 years. Congress has got more than 30% votes in the last six elections. In the last seven Lok Sabha elections in the fourteen-member Assam Lok Sabha, the Congress had won the maximum number of 10 seats in 1998 and 1999. Except in 2014, the Congress has always secured around 35% of the votes.
- Kerala: About 89 lakh Muslim population resides in the state i.e., 26.56% of the total population of the state and 5.15% of the total Muslim population of the country. The seat and vote percentage of Congress in the Lok Sabha and Assembly elections held in or after 1995 can be seen in the table 11 & table 12 respectively.
Table KL1 (General Election results)
| 1996 | 1998 | 1999 | 2004 | 2009 | 2014 | 2019 | |
| Total Seats | 20 | 20 | 20 | 20 | 20 | 20 | 20 |
| Contested | 17 | 17 | 17 | 17 | 17 | 15 | 16 |
| Seats won by INC | 7 | 8 | 8 | 0 | 13 | 8 | 15 |
| INC vote % | 38% | 38.7% | 39.4% | 32.1% | 40.1% | 31.5% | 37.5% |
Table KL2 (Assembly Election Results)
| 1996 | 2001 | 2006 | 2011 | 2016 | 2021 | |
| Total Seats | 140 | 140 | 140 | 140 | 140 | 140 |
| Contested | 94 | 88 | 77 | 81 | 87 | 93 |
| Seats won by INC | 37 | 62 | 24 | 38 | 22 | 21 |
| INC vote % | 30.4% | 31.4% | 24.1% | 26.4% | 23.8% | 15.2% |
There is a total of 32 Muslim MLAs in the 140-member Kerala Assembly. The 15 Muslim MLAs elected to the Kerala Legislative Assembly are from the Indian Union Muslim League (IUML). Of the rest, 3 are from Congress, 9 from CPI(M), 1 from the Indian National League and National Secular Conference, and three others are independents. In 2016, there were a total of 29 Muslim MLAs in the Kerala Legislative Assembly. In the last 26 years, in the six elections to the Kerala Legislative Assembly, the Congress has won twice and the Communist Party has won four times. The vote share of the Congress has been falling continuously except in the 2001 elections. In the elections held in 2021, the Congress got the lowest in 26 years with 25.2% of the vote and only 21 seats. The Congress’s performance in the Lok Sabha election was its best in 2019 when it secured 15 seats and 37.5% of the votes. The vote share of Congress has always been more than 30% and in 1998, 1999 and 2004 the vote share figures were around 40%.
CONCLUSION
Congress (INC) has won 43, 57, 45, 40, 66, 21 and 23 seats in the Lok Sabha elections of 1996, 1998, 1999, 2004, 2009, 2014 and 2019 respectively. These are the six states where the Muslim population is approximately 65% percent of the total population of the country. This clearly shows that there has been a steady decline in the number of seats contested and the success rate in the Muslim-dominant areas.
Table-CON1
Table-CON2: State-wise total seats contested and won by INC in the last seven general elections.
On the other hand, if we talk about the Legislative Assembly of these six states, then Congress is out of power in Uttar Pradesh for 33 years, in West Bengal for 45 years, in Bihar for 32 years, in Assam and Kerala for 6 years. It is the number four party in Maharashtra and has been in the coalition government for the last three years after being out of power for five years. In Uttar Pradesh, the Congress’s base has shifted to the Samajwadi Party and the Bahujan Samaj Party, while in Bihar, the Rashtriya Janata Dal and the Janata Dal United have been successful in garnering the Congress vote bank. The Muslim community vote in West Bengal was divided between the Left and the Congress, but after the rise of AITC, Muslim voters turned their attention to Ms. Mamata Banerjee. After the rise of the NCP in Maharashtra, Muslim votes began to split between the Congress and Sharad Pawar’s NCP, directly benefiting the BJP and Shiv Sena. Muslim votes in Kerala continued to be divided between Congress, IUML, and Left, while in Assam Muslim voters preferred to split their vote between Congress and regional parties until BJP became stronger, but in Assam, Muslim voters have preferred to vote for Congress and AIUDF due to the growing political influence of BJP.
Overall, Muslim voters have preferred regional parties over the Congress because regional parties have caste-specific vote banks and Muslim voters feel that regional parties are better than the Congress in taking on the BJP. At present, apart from these six states, Muslim voters are Jammu and Kashmir (4.97%), Andhra Pradesh (4.69%), Karnataka (4.58%), Rajasthan (3.61%), Gujarat (3.39%), Jharkhand (2.78%) . , Madhya Pradesh (2.77%), Tamil Nadu (2.46%), Delhi (1.25%), Haryana (1.03%). Out of these states, Congress is in power only in Rajasthan, Tamil Nadu, and Jharkhand (Alliance). Of the sixteen states in which the Muslim population constitutes 97.75 percent of the country’s total population, only one state has a Congress government and three states have coalitions. Of the remaining twelve states, seven are governed by the BJP (alliance in Bihar) and five by other parties.